
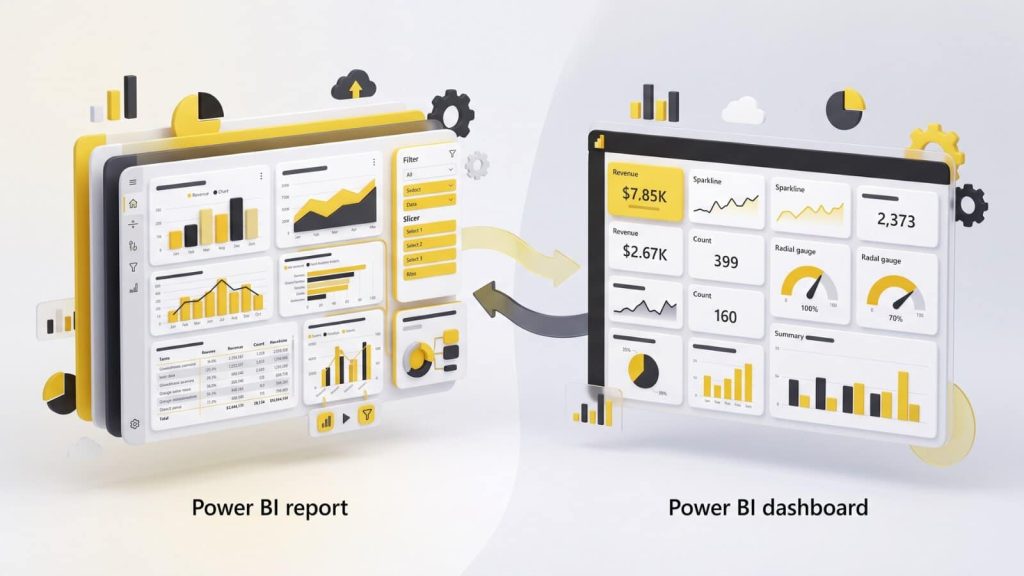
Power BI gives teams more than one way to distribute insights, but report sharing and dashboard sharing are not the same thing. A report gives users detailed pages, filters, visuals, drill paths, and deeper analysis. A dashboard gives users a one-page view built from pinned tiles and high-level signals. If teams mix them up, they may share too much detail, confuse users, or lose control over access. This guide explains when to share each one, how they differ, and how to keep internal and external sharing safer.
What Is the Main Difference Between Report Sharing and Dashboard Sharing?
Teams share power bi reports when users need deeper analysis, filters, pages, and interactive views from the same semantic model. Reports are built for exploration, so users can move through different pages and inspect data from different angles. Microsoft describes a Power BI report as a multiperspective view into a semantic model, with visuals that show findings and insights.
Dashboard sharing is different because a dashboard is a one-page view. Microsoft explains that dashboards are limited to one canvas, while reports can have many pages. That makes dashboards better for quick monitoring, leadership summaries, and high-level business signals.
The difference matters because sharing the wrong format creates confusion. A manager who needs details may feel limited by a dashboard, while an executive may feel overwhelmed by a full report. Good sharing starts by matching the format to the user’s decision.
How Power BI Report Sharing Works
Report sharing gives users deeper analysis because reports support multiple pages, filters, interactions, and detailed exploration across one semantic model.
What Report Sharing Includes
Power BI report sharing gives users access to report pages, visuals, filters, and interactions. Users can explore data in Reading view, while report designers work in Editing view. Microsoft explains that Reading view is the normal way business users consume reports created by others.
When Report Sharing Works Best
Report sharing works best when users need more than a summary. Sales managers may need regional filters, product pages, pipeline breakdowns, and account-level views. Finance users may need budget details, variance pages, and drill paths behind headline numbers.
Risks of Report Sharing
Report sharing can expose too much detail if access is not planned carefully. Users may see pages, filters, or data views that were not meant for their role. Teams should check workspace roles, direct access, app audiences, and semantic model permissions before sharing reports widely.
How Power BI Dashboard Sharing Works
Dashboard sharing gives users a simpler way to monitor key information. A dashboard can combine tiles from different reports, semantic models, Excel, Q&A, and other sources. Microsoft describes dashboard tiles as snapshots of data that can be pinned to a dashboard.
Dashboards work well when users need one fast view instead of a full report experience. A leadership dashboard may show revenue, margin, churn, pipeline, and customer health in one place. The user can scan the page quickly and open linked details when needed.
Dashboards also work well for status reviews. Teams can use them to monitor KPIs, exceptions, alerts, and business movement. They should not replace detailed reports when users need page-level analysis or flexible filtering.
Report Sharing vs Dashboard Sharing: Quick Comparison
The easiest way to choose the right sharing method is to compare audience needs, depth, interaction, control, and ongoing maintenance.
- Reports are better for detailed analysis because users can move across pages, filters, visuals, and drill paths easily.
- Dashboards are better for quick summaries because users see key signals from multiple reports on one page clearly.
- Reports usually support deeper interaction, while dashboards focus more on monitoring, scanning, and opening linked report details quickly.
- Report sharing needs stronger page, dataset, and Build permission review because users may explore more data than expected.
- Dashboard sharing needs clear tile ownership, because pinned visuals can depend on reports and semantic models underneath them.
- Both methods need regular access reviews, especially when shared content includes sensitive finance, HR, sales, client, or operational data.
When Should You Share a Report Instead of a Dashboard?
Share a report when users need detail, exploration, filtering, and context beyond the one-page summary a dashboard can provide safely.
Detailed Analysis
Reports are the better choice when users need to investigate performance. They can move between pages, compare visuals, apply filters, and review supporting details. This helps users answer follow-up questions without asking the report builder for another view.
Role-Based Exploration
Reports work well when different roles need different levels of detail. A director may need regional pages, while a team lead may need account or employee-level views. With the right permissions and row-level security, one report can support several audiences.
Report Collaboration
Reports are also better when analysts or business teams need to review and improve content. Builders can update visuals, improve measures, and adjust pages as business questions change. This makes reports stronger for ongoing analysis than static summary views.
When Should You Share a Dashboard Instead of a Report?
Share a dashboard when users need a fast, simple, high-level view. Dashboards are useful for executives, department heads, client summaries, and operational teams that need quick status checks. The goal is not deep exploration; the goal is fast understanding.
Dashboards also help when users need signals from several reports in one place. Microsoft notes that selecting a dashboard visualization can take users to the underlying report and semantic model. This makes the dashboard a starting point for deeper analysis when needed.
Use dashboard sharing when the audience should not spend time moving through many report pages. A dashboard can show what is on track, what changed, and what needs attention. It works best when every tile has a clear purpose.
Sharing Rules That Keep Power BI Content Safe
Safe sharing depends on clear owners, role-based access, controlled links, app audiences, guest reviews, and semantic model permissions for governance.
- Use apps for broad distribution, because users get approved reports and dashboards without full workspace access inside Power BI.
- Limit direct sharing to smaller groups, because one-off access becomes hard to review as audiences grow over time.
- Review semantic model permissions, because shared data can let users build new reports from sensitive datasets later too.
- Avoid Publish to web for private content, because public links can expose reports beyond intended users very quickly.
- Use groups instead of individuals, because department, client, or role changes become easier to manage at scale later.
- Remove old guest access when projects end, so external users do not keep unnecessary content access over time.
How to Share Power BI Dashboard Externally Safely
When teams share power bi dashboard externally, they need tenant settings, guest identity, licensing, access scope, and removal rules planned first.
Tenant Settings and Guest Identity
External sharing should start with admin settings, not a random link. Microsoft states that external sharing must be enabled in tenant settings before Power BI content can be shared outside the organization. External users can also receive access through Microsoft Entra B2B guest sharing.
Audience Scope
External users should only receive the dashboard, report, app, or semantic model access they need. Do not add clients or vendors to full workspaces unless they truly support the build process. Keep client-facing dashboards separate from internal reports, draft pages, and sensitive operational models.
Access Review
External access should never stay open without review. When a client project ends, remove direct sharing, app audience access, workspace access, and related guest permissions. A simple monthly review helps stop old external access from becoming a hidden security problem.
Conclusion
Power BI report sharing and dashboard sharing support different user needs. Reports are better when people need pages, filters, drill paths, and deeper analysis. Dashboards are better when people need a fast one-page summary of important signals. The safest approach is to choose the format based on audience, decision depth, and access risk. Use reports for exploration, dashboards for monitoring, apps for broad distribution, and guest controls for external users. When sharing rules are clear, Power BI content becomes easier to manage, safer to distribute, and more useful for business decisions.